
Measure of Agreement
How to Perform and Interpret Measure of Agreement
Measuring agreement among assessors, evaluators or raters is common in research. Often, the researcher wants to measure the agreement or not between two raters or between more than two raters. For two raters, Kappa measure of agreement is employed while for more than two raters intra-class correlation (ICC) is employed.
The Kappa Measure of Agreement
Cohen's kappa measures the agreement between the evaluations of two raters (observers) when both are rating the same object (situation or patient). A Kappa value of 1 indicates perfect agreement. A value of 0 indicates that agreement is no better than chance. Values of Kappa greater than 0.75 indicates excellent agreement beyond chance; values between 0.40 to 0.75 indicate fair to good; and values below 0.40 indicate poor agreement. For Kappa measure of agreement, the two raters must use the same categories during the assessment. Usually, the raters put cases in several categories based on their judgement.
The table structure of the Kappa statistics is a square table, that is, has the same row and column categories because each subject is classified or rated twice. For example, doctor A and doctor B diagnose the same patients as schizophrenic, manic depressive, or behaviour-disorder. Do the two doctors agree or disagree in their diagnosis? Two teachers assess a class of 18 years old students. Do the teachers agree or disagree in their assessment? The Kappa statistic provides answers to these types of questions.
It is common in higher education for two independent markers to assess the final year project of students. How can we be sure that there is agreement between the markers. One way is to look at Kappa measurement of agreement between the markers. Look at the data file below that put students into quartiles based on performance. In the data file, the following code was used to specify each quartile:
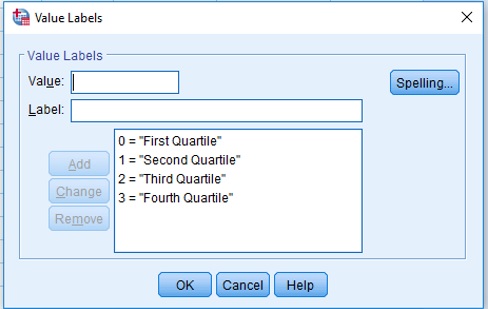
Kappa Figure 1
Create the data file in SPSS so you generate the output shown below following the instructions provided.
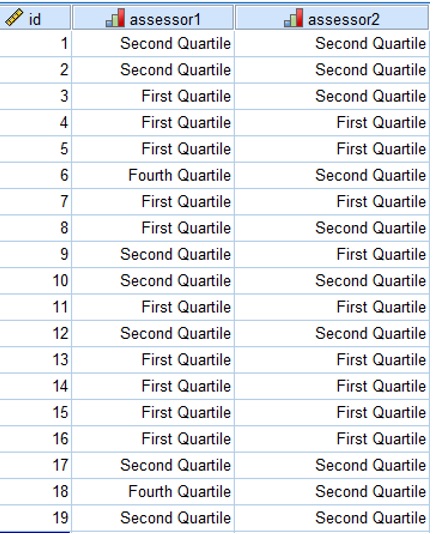
Kappa Figure 2
To produce the output follow the instructions below:
Analyze – Descriptive Statistics – Crosstabs…
Row(s): Assessor 1 [assessor1]
Column(s): Assessor 2 [assessor2]
Statistics…
Select kappa,click Continue
Cells…
Percentages: select Total, click Continue then OK
Examine and interpret the output.
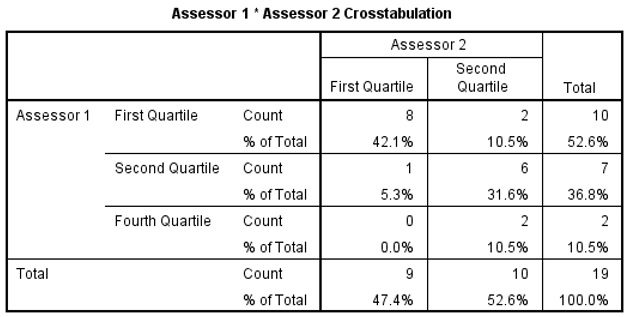
Kappa Figure 3
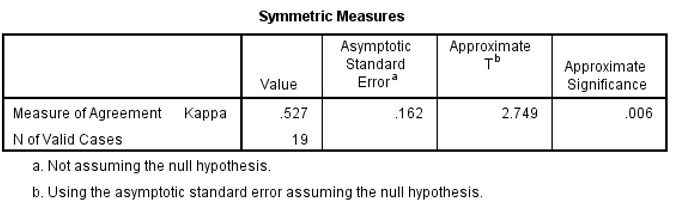
Kappa Figure 4
Look at the tables from the output. What can you conclude?
|
The quartile rating of the students are the same for 14 (73.7%) of the 19 students; 14 is obtained by adding all the entries in the leading diagonal (Fig. 3). The value of Kappa is 0.527, indicating fair agreement between the assessors. The t statistics for testing that the measure is 0 is 2.749 with of significance 0.006 (Fig. 4). The 95% Confidence Interval (CI) of Kappa is 0.527-2*0.162 to 0.527+2*0.162, or 0.203 to 0.851. Note that the CI is obtained by multiplying the asymptotic standard error by 2 and then subtracting the result from the Kappa value to get the lower bound and adding it to the Kappa value to get the upper bound of the CI. |
Intra-class Correlation Coefficients (ICC)
Use ICC to assess inter-rater agreement when there are more than two raters. For example, the International Olympic Committee (IOC) trains judges to assess gymnastics competitions. How can we find out if the judges agree? ICC can help us to answer this question. Judges have to be trained to ensure that good performances receive higher scores than average performances, and average performances receive higher scores than poor performances; even though two judges may differ on the precise score that should be assigned to a particular performance.
Use the data set judges.sav to illustrate how to use SPSS to calculate ICC. The data set is stored in this location \\campus\software\dept\spss.
Open the data set. From the menu select:
Analyze -> Scale -> Reliability
Items: judge1, judge2, judge3, judge4, judge5, judge6, judge7.
The completed dialogue box looks like this:
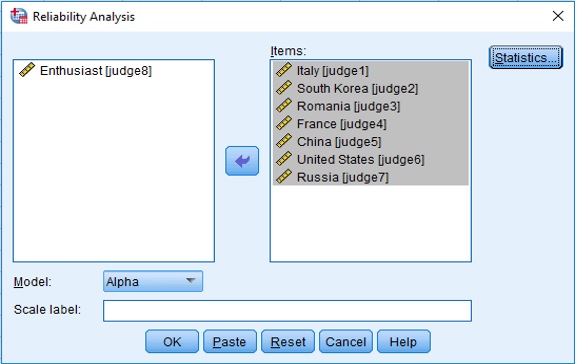
Kappa ICC Figure 5
Statistics… Under Descriptives for check Item.
Check Intraclass correlation coefficient
Model: Two-Way Random
Type: Consistency
Confidence interval: 95%
Test value: 0
The completed dialogue box looks like this:
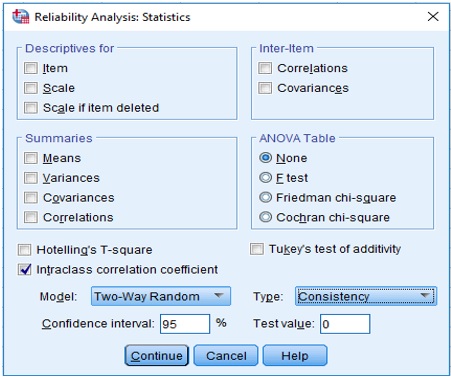
Kappa ICC Figure 6
Note that for Model: Two-Way Random is selected because the gymnasts are a random selection from a population of gymnasts and the judges are a random selection from a population of judges. Under Type: Consistency is selected because we are not interested in absolute agreement.
This procedure generates three tables. The most important one is shown below.
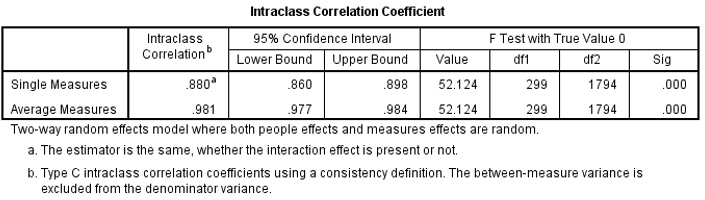
Kappa ICC Figure 7
Examine and Interpret the output. What would you conclude?
|
The item statistics shows the averages, and standard deviations of the 7 judges. The Chinese and Romania judges with the lowest averages, score harshly while the American, France and South Korea judges with the highest averages are more generous (Table not shown). With ICC of 0.981 (95% CI 0.977 – 0.984) the judges score are reliable and the process of training judges was successful in separating different level of performance (Figure 7). |