
Linear Regression
How to perform and interpret Linear Regression Using SPSS
Introduction
Linear regression is used:
- To build a model for making prediction.
- To see how well the independent (explanatory, or predictor) variables explain the dependent (response, or outcome) variable.
- To identify which subsets from many independent variables is most effective for estimating the dependent variable.
Like most statistical procedure linear regression has certain assumptions that your data must satisfy in order to produce a good model. The assumptions are:
- All observations should be independent.
- Your data should not suffer from multicollinearity. That is the independent variables should not be highly related.
- Residual from model fit should follow a normal distribution.
- Each of the independent (explanatory or predictor) variables should have a linear relationship with the dependent (response or outcome) variable. It is always a good idea to check this assumption using a matrix scatterplot.
Simple Linear Regression and Multiple Linear Regression
If there is only one predictor it is simple regression model which can be represented mathematically as:

If there are two or more predictors it is a multiple regression model represented as:

y is the response variable and , x1, x2, are the predictor variables and ξ is the error term; b1, b2 are coefficient given by SPSS.
Example
You may be interested to model the relationship between energy consumption and temperature in buildings. A possible data to collect is shown on Table 1.
Table 1: Energy Consumption

Preparing the Data set
Prepare and enter the data into SPSS Data Editor Window. If you do not know how to create SPSS data set see Getting Started with SPSS for Windows. Define the four variables tempf, insu, oilconsu, and bedrooms, and provide fuller labels Average Outside Temperature in Degre Fahrenheit, Insulation in inches, Oil Consumed in January (gallons), and Number of bedrooms in household respectively. The completed data set look like the one shown above in Table 1
Do temperature, insulation and number of bedrooms affect the energy consumption in a building? We want to build model of the form:

where Energy Consumption is the dependent (response, y, or outcome) variable, temperature, insulation, and bedroom are the independent (explanatory or predictor) variables, is the intercept of the line of best fit, , are coefficient given by SPSS and is the error term.
Is there a linear relationship between Energy Consumption and temperature, insulation, and bedroom? Produce a matrix scatter plot to help you answer this question.
Select Graphs -> Scatter… Matrix -> click on Define. Transfer the variables tempf, insu, bedrooms, and oilconsu into the Matrix Variables: text area and click OK. The complete dialogue box is shown below:

Double-click on the graph and add trend line via Elements -> Fit Line at Total in the Chart Editor window. The generated matrix plot is shown below. Note that the red squares have been added to show the scatterplots of interest.
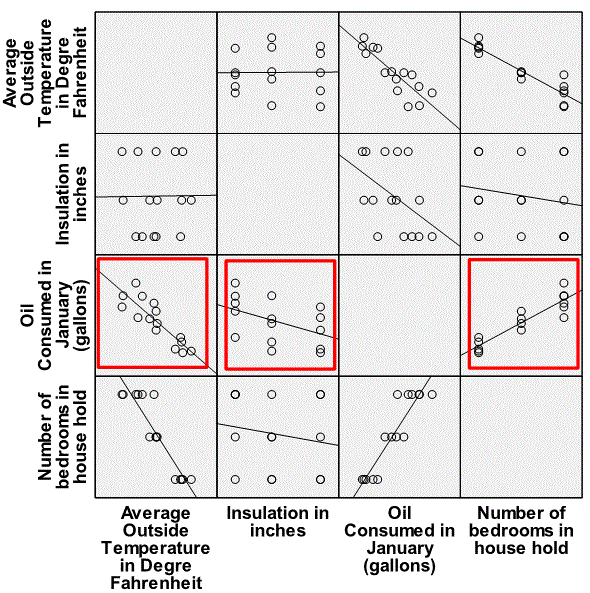
Examine the graph. It is clear that Energy Consumption is linearly related to each of the independent variables (temperature, insulation and bedrooms) thus satisfying the assumption number 4. Some sort of variable transformation would have been taken if the relationship was not linear. Temperature and insulation have a negative relationship with energy consumption; as temperature or insulation decreases energy consumption increases. The relationship between energy consumption and bedrooms is positive; as bedrooms increases energy consumption also increases.
Running the Linear Regression Procedure
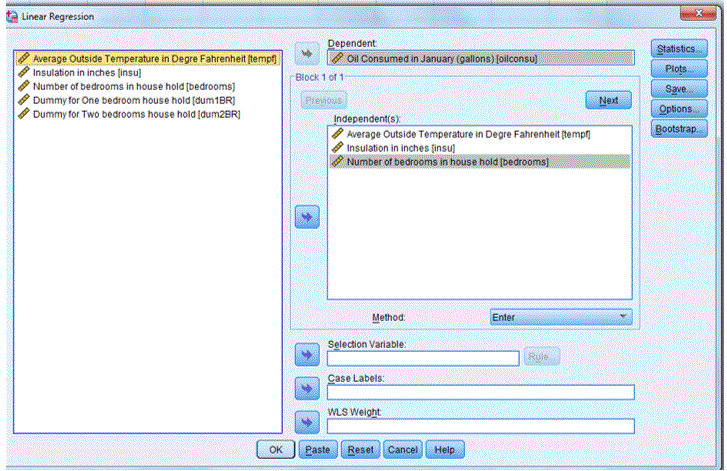
To produce the output for the regression model, from the menus choose:
Analyze -> Regression -> Linear….
Dependent Variable: Oil Consumed in January (gallons) [oilconsu]
Independent: Average Outside Temperature in Degree Fahrenheit [tempf], Insulation in inches [insu] and number of bedrooms [bedrooms]
Statistics…
Descriptives
Make sure that Estimates and Model fit are selected.
Select Collinearity diagnostics (this will assist us in checking assumption 2)
Plots…
Select Histogram and Normal probability plot (this will assist us in checking assumption 3)
Click OK to generate the output. The completed dialogue box is shown below:
These steps will generate lots of output. We will now examine the relevant part of the output and attempt to interpret it.
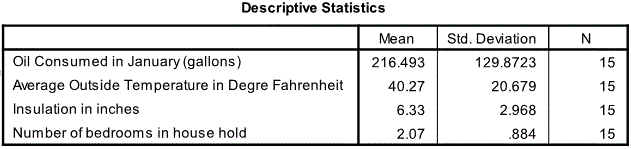
The first relevant table is the descriptive statistics table shown below:
Descriptive Statistics
This shows the descriptive statistics of all the four variables. The statistics shown are the mean (average), standard (std.) deviation and N (sample size). The average energy consumption of all the 15 buildings in the study is 216.5 gallons with a standard deviation of 129.9. The corresponding figures for the other variables are shown on the able.
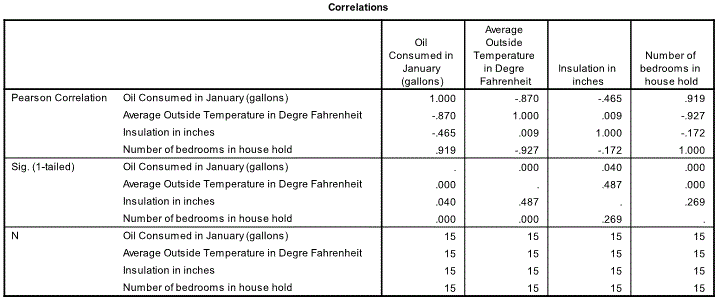
Correlation
The next relevant table is the correlation table. This gives the bivariate relationship between the variables. Here we are more interested in the correlation between the independent variables. There may be concern that number of bedrooms and temperature with a correlation coefficient of -0.927 (p=0.000 best report it as 0.001) is highly correlated. We will revisit this issue later. The other correlation between insulation and number of bedrooms of -0.172 (p=0.269) is no cause for concern.
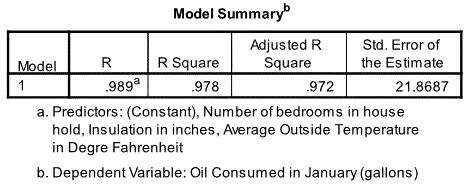
Model Summary
The next relevant table is the model summary table. The value of R (also called multiple R) is 0.989. It is the same as the correlation coefficient for simple linear regression. R2=0.978 is the square of 0.989. R2 is interpreted as the proportion of the total variation in energy consumption accounted for by the three independent variables (temperature, insulation and bedrooms). In other words temperature insulation and bedrooms “explains” 97.8% of the variability of energy consumption. R2 is a measure of the goodness of fit of the linear model. It is also known as the coefficient of determination. The sample estimate of R2 tends to be an optimistic estimate of the population value. Adjusted R Square (97.2%) relates closely to the population value. Std. Error of the estimate (21.9) is the square root of the residual mean square and measures the spread of the residuals (or errors) about the fitted line. If it is not smaller than the standard deviation of the dependent variable then the regression model is not better than using the mean as a predictor of the dependent variable. 21.9 compares favourably with 129.9.
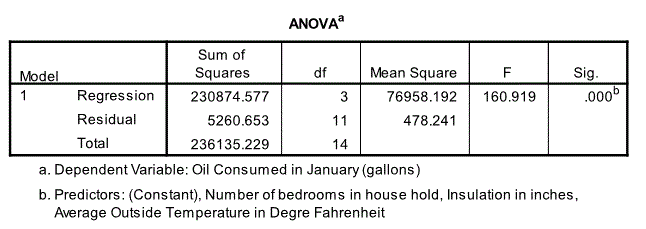
ANOVA (Analysis of Variance)
The next relevant output is the ANOVA table. The ANOVA table test the following hypotheses
Null (H0): b1, b2, and b3 = 0, i.e. there is no regression versus
Alternative (H1): b1, b2, b3≠ 0, i.e. there is some regression.
The test statistic is
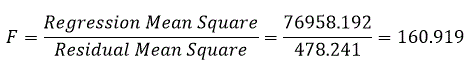
Under H0 the Mean Squares should be equal, i.e. F should be 1.
Here F(1,14) = 160.919 and P = 0.005 (< 0.05). Hence we reject H0 at the 5% significance level and conclude that energy consumption may be linearly dependent on temperature, insulation and bedrooms.
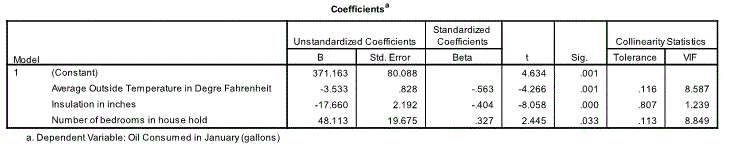
The next relevant table is the coefficients table. The estimates of the model coefficients (intercept) and , (slope) are 371.163, -3.533, -17.660 and 48.113 respectively. So the estimated model is:

Note that we can use the equation above to predict the energy consumption of a building we know the temperature, insulation and the number of bedrooms.
The table also gives the standard error for all the coefficients in the equation. The standardised coefficient (or beta) is also provided. Next are t statistics which is got by dividing each coefficient with its standard error. The first t statistics of 4.634 with its associated p value of 0.001 test the null hypothesis that the intercept ( is zero against the alternative hypothesis that the intercept is not zero; here we reject the null hypothesis. The second t statistics for temperature of -4.266 with its associated p value of 0.001 test the null hypothesis that the slope ( is zero against the alternative hypothesis that the slope is not zero; here we reject the null hypothesis; and so on.
Even though we have established that there is an association between energy consumption and temperature, insulation and bedrooms, we cannot conclude that if you increase any of the independent variable the energy consumption will increase. The data is from an observational study and not a controlled experiment. Statements about cause-and-effect can only been made in a controlled experiment. The tolerance value is greater than 0.1. There is no problem with multicollinearity, even though the correlation between number of bedrooms and temperature was high as noted earlier.
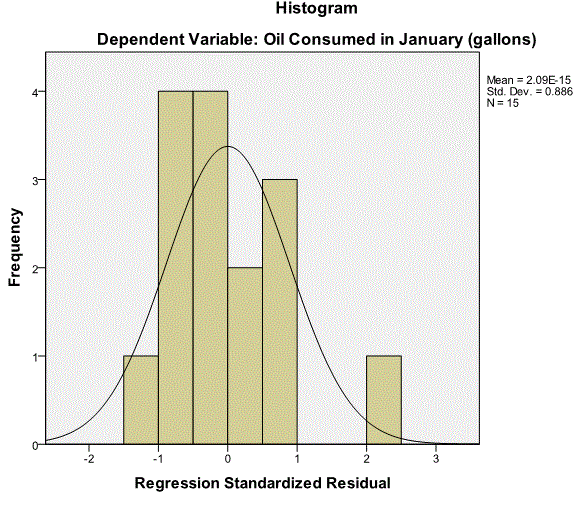
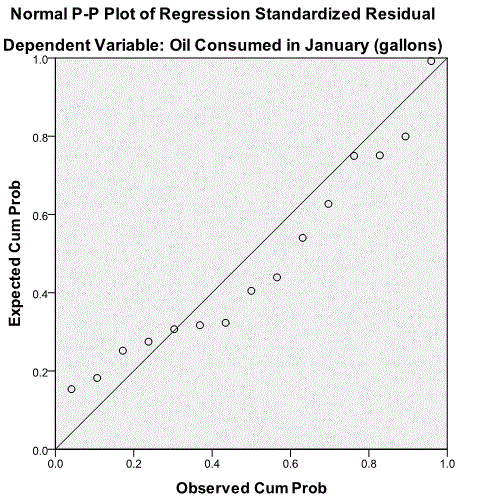
Histogram and Normal P-P Plot
The next relevant output is the histogram and normal p-p plot. The histogram looks reasonably normal and on the normal P-P plot the points are close to the line, the residuals follow a normal distribution.
Restriction
Predictions using the generated model would have to be limited to the range of values for temperature, insulation and number of bedrooms used for building the model.
Validation
For the model to widely adopted, it has to be validated. The model can be validated using one of the following method:
By collecting new data and comparing the model prediction to the actual observation. Or if you had a large data set, to divide the data set into two. Use one to build the model and the other to validate the model. You may have to use the correlation procedure to compare model prediction to actual energy consumption
How to report linear regression (Summary)
Linear regression indicates that temperature, insulation and bedrooms are significant predictors of energy consumption [F(1,14) = 160.919 and P = 0.005 (< 0.05)]. In other words temperature insulation and bedrooms “explains” 97.2% of the variability of energy consumption. All the predictors are significant at the 5% level [temperature t=-4.266, p=0.001 (<0.05); insulation t=-8.058 p=0.001 (<0.05) and bedrooms t=2.445 p=0.033 (<0.005)]. Standardised beta coefficients indicates that temperature contribute the most (beta =0.563) followed by insulation (beta=0.404) and then bedrooms (beta=0.327). The data was suitable for linear regression as it satisfied all the assumptions needed for the linear regression model.